
This year marks 40 years since the FTSE 100 was launched. Known colloquially as the “footsie”, this index tracks the 100 biggest companies in the UK.
In its 40 years, the FTSE 100 has survived several significant market shocks and generated a healthy return for investors. Read on to learn more about the index’s performance over the past four decades and what it could mean for you if you have investments in it.
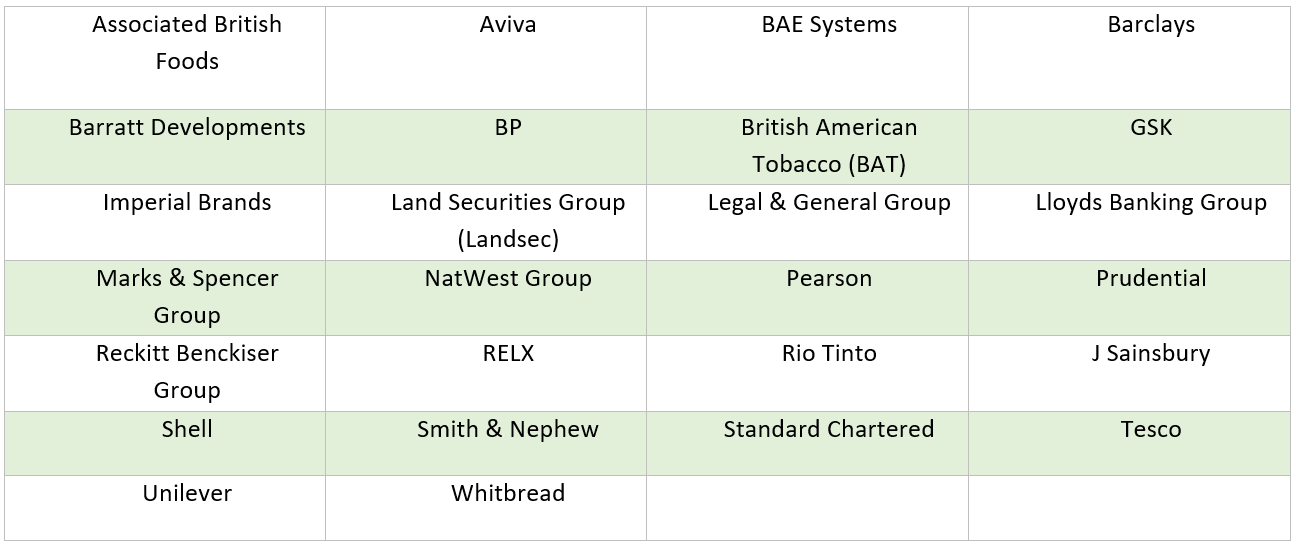
The FTSE 100 still features 26 of its original 100 companies, though some are in a different guise
The FTSE 100 tracks the 100 largest companies on the UK stock exchange, and the list is updated quarterly to reflect the changing landscape.
In 2024, 26 of the original 100 companies remain in the group, as you can see in the list below. Of these, 14 still have the same name as they did in 1984 while others have changed their name, often as a result of mergers and acquisitions.
Though the companies that appear in the index may have changed, the composition of sectors represented on the FTSE 100 is not significantly different than it was in 1984:
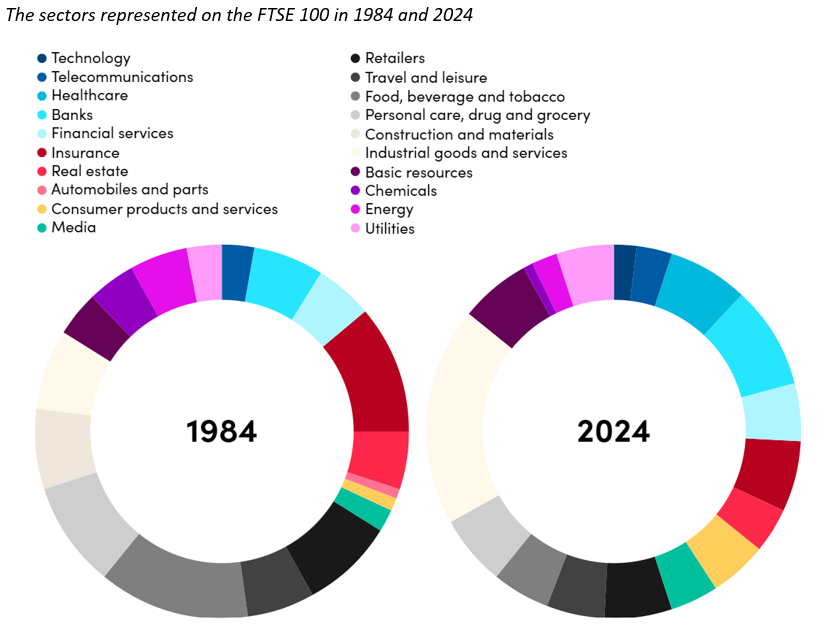
Source: Raconteur
Fidelity reflects that the changes that have occurred on the index reflect the way that Britain has developed in that time. While lots of names have been replaced on the index by newer companies, much remains constant.
The financial landscape, for example, continues to be dominated by companies like NatWest, Barclays, Lloyds, and Standard Chartered, who have all maintained their place in the index. The retail space is also familiar, with names like Sainsburys and M&S remaining constant since the index’s launch. Similarly, property remains an important part of the index.
So, while at first glance the index looks quite different today than it did 40 years ago, its essential makeup hasn’t changed significantly.
The FTSE has experienced its fair share of volatility, but has continued to grow regardless
The Guardian reports that, since its launch on 3 January 1984, the FTSE has risen from 1,000 points to 7,733 points on the final trading day of 2023. Its annualised rate – assuming you reinvested dividends – is just above 8%, which exceeds the average rate of inflation for those years.
To give some more context, the report shares that if you had invested £1,000 on the first day of its launch and had reinvested dividends since then, you could have grown your investment to £22,550 in January 2024.
Despite these favourable figures, the FTSE 100 hasn’t escaped volatility.
Hargreaves Lansdown reports that the worst days for the index were 19 and 20 October 1987, known as “Black Monday and Tuesday”. The index fell by 12.22% on 19 October and by a further 10.84% on 20 October.
In more recent years, the index fell by 10.87% losing £160 billion on 12 March 2020 as countries across the world witnessed the spread of Covid-19.
While market crashes like these can be concerning for investors, it can be helpful to consider them in the context of historical trends. The graph below shows the performance of the FTSE 100 in response to some of the major economic and market events of the past 40 years.

Source: The Guardian
As you can see, some of the biggest increases in value happened shortly after the crashes, though this is no guarantee that the same might happen again. This means that it may be more sensible to stay invested through market crashes than to cash out, depending on your personal circumstances.
We recommend that you consult your financial planner before making changes to your portfolio or if you are concerned about the effect that market volatility might have on your investments. They can advise you of the most sensible steps to take for you.
Growth has been slower than some US indexes due to a lower allocation of technology stocks
You may have noticed some headlines suggesting that the FTSE 100 is being left behind by its US cousins. While the index has delivered positive average annual returns, its performance in recent years has slowed.
Corporate Adviser reports that, since 2000, the FTSE 100’s average annual returns have been just 0.4%, compared to 6.1% for the S&P 500. According to a report by the Guardian, most major stock indexes have surpassed the FTSE 100’s disappointing returns of 3.8% over the past 12 months.

Source: J. P. Morgan
The Guardian report suggested that this could be due to the outperformance of tech stocks, which make up a much larger proportion of US stock indexes. Moreover, poor economic performance in the UK this year may have led to investors being more cautious.
This serves as a helpful reminder of the importance of diversification. By balancing your portfolio with a range of asset classes spread across different regions, you may be able to mitigate the impact of underperformance in one area.
Get in touch
If you’d like to learn more about creating a balanced portfolio that can help you to achieve your long-term financial goals, we can help.
Email enquiries@metiswealth.co.uk or call 0345 450 5670 today to find out what we can do for you.
Please note
This article is for general information only and does not constitute advice. The information is aimed at retail clients only.
The value of your investments (and any income from them) can go down as well as up and you may not get back the full amount you invested. Past performance is not a reliable indicator of future performance.
Investments should be considered over the longer term and should fit in with your overall attitude to risk and financial circumstances.